Assigning map projections to portolan maps
Chryssoula Boutoura*
e-Perimetron, Vol.1, No. 1, Winter 2006 [40-50]
www.maplibrary.gr/e_perimetron | ISSN 1790-3769
Assigning map projections to portolan maps
Keywords: Late medieval and renaissance cartography; nautical maps; map projections; history of cartography; map analysis; map comparison; raster map processing.
Summary
In spite of the widely spread impression that the portolan-maps are projection-less, some authors, during the last two centuries, treated the relevant problem, mainly from a theoretical or intuitive point of view. The results are all indeed interesting and worth to study, but the overall outcome is that it is not yet possible to formulate a self-consistent and globally accepted theory on the existence or not of underlying projections in portolan-maps. A main shortcoming in such studies is the huge amount of analytical computations required for the testing of alternative hypotheses and assumptions in treating numerically the required best fitting solutions. This shortcoming is not an obstacle today thanks to the new digital analytical processing methods and techniques available. In this paper a digital raster- processing environment is used in order to test empirically best fitting projections of some portolan-maps of the Mediterranean and the Aegean Sea. The results seem to be stimulating for such type of research.
Introduction
A generally spread impression, or belief, among experts on late medieval to mid-renaissance nautical maps of portolan-type is that an underlying map projection is totally missing. A widely diffused idea is that, the ‘geometric basis’ of portolan-maps is implied by the visible dense pattern of intersected directions of the wind, originated at some nodal points placed regularly, on the circumference of single or double circles. In the specialised cartographic literature, however, the issue is not indeed new.
Fiorini, more than a century ago (1881: 680), discussed some hypotheses on the projective basis of the medieval nautical maps. A number of theories developed since then (Campbell 1987: 385) and some analytical experiments were also carried out (Tobler 1966: 351) in order to approach, understand, assume or approximate the projective nature of these fascinating maps. The traditional approaches to the problem concerning the projective underlayment of nautical maps used as models the standard cylindrical or conic or azimuthal equidistant projections or some of their variants. From all analyses carried out it is not indeed possible to draw a definite conclusion on the proper projection to be assigned to the portolan-maps. The various conclusions are controversial and do not formulate a globally consistent theory on the issue. A main problem related to the difficulties in this field of analysis was the huge amount of computational tests, which are necessary in order to obtain results from a great number of cases satisfying a variety of portolan maps.
This fascinating problem seems to regain a new interest thanks to the new digital technologies (informatics and infographics), which are properly designed and suitable for the transformation of old maps in raster-form and for their digital reset and analysis. In this way, the study of possible projective underlayment in portolan-maps becomes a friendly, easy to handle and fast process, offering possibilities and alternatives in testing, becoming, thus, an attractive issue again. In this context, relevant promising research has been carried out with, at least, promising results, see e.g. Forstner & Oehrli (1998: 35) with an extended literature in it, Guerra et al. (1999: 93), Boutoura (2000: 78), Balletti (2000), Balletti & Boutoura (2001: 296), Boutoura & Livieratos (2004: 181), Livieratos (2004: 363).
The underlying theory
The theory underlying the problem is formulated in this way: Once an old map with unknown projective properties is set in digital form, a known map projection model can be used in order to test its optimal fitting to the old map. Obviously, the optimal fitting is controlled by the magnitude of the computed residuals associated to the deformations induced by the selected projection test model in order to fit optimally the old map. The real problem here is the selection of the projection test model and of the proper spatial distribution of the control points, which are necessary and sufficient in order to perform a suitable process. It is also important to dispose a tool for the interactive visualisation of the fitting results. In many cases, visualisation of the associated residuals gives the proper path to follow. In our case and for obvious reasons, the ‘trial and error’ approach is the only realistic way to tackle the problem regulated almost exclusively by the researcher's expertise in map projections.
This approach, unthinkable in the past, is now easy using the relevant powerful software operating in unified computational and graphical environment. The advantage of working in such digital environment is focused mainly on the instant visual control of the optimal fitting, which follows the computational process. In this way the ‘trial and error’ control is on-line accepted or rejected leading to a convergent result of the optimal fitting tests.
A constructive theory could be based on the identification of a single map projection satisfying the optimal fitting of a rather large number of old maps made in different times and by different mapmakers. If this condition is satisfied, in the context of optimality, it means that the relevant test-projection assigned to the old map is most probably the ‘masked’ projection used by the mapmaker, empirically, intuitively or even unconsciously in the case of copying from older maps.
Testing the theory
In order to test our ‘trial and error’ theory and the possible extraction of a ‘masked’ projection in the portolan maps, two groups of maps, in different map-scale, were used. The first group of samples by Giorgio Sideri, Francesco Olliva and Nikolaos Vourdopoulos, all taken from Μollat du Jourdin & de La Ronciere (1984: 237, 243, 245), represent the wider Mediterranean area, dated the first from the second half of 16th century and the other two from the early 17th century. The second group of images (kindly available from ‘Museo Correr’ of Venice[1]), by Pietro Vesconte, Antonio da Millo and Mehmet Reis, see, e.g., in Baso & Scarso (2000: 57), Boutoura (2000: 82), Biadene & Tonini (2000: 28), represent the Aegean Sea, dated the first from the early 14th century and the other two from the late 16th century. The published images of maps were scanned and the relevant digital files were used for the analysis. Next step was the search for a projection, which possibly fits all the maps optimally.
Opting for a test projection
Expertise in map projections and attentive observation of the ‘coastline tracing’ of the Mediterranean Sea and of its overall geometric placement in the map could help the decision on what type of test projection one has to opt for the starting of a ‘trial and error’ process towards an optimal fitting. The study of the selected test maps the following characteristics are apparent:
(a) The western side of the old map-frame is parallel to the western coasts of the Iberian Peninsula, which is actually extended along the 7 degrees and 47 minutes meridian.
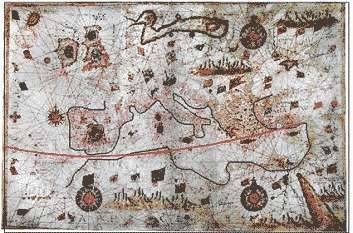
(b) The 36 degrees parallel[2] is slightly tilted north wise along the west-east direction (Fig. 1) by a c. 10 degrees rotation, a figure confirmed by other authors as well (see, e.g., Astengo 2000).
Figure 1. [See, Map at the beginning of this entry]. The 36 degrees parallel, diaphragma (red curve), on Sideri’s map is slightly tilted northwards at the east end by c. 10 degrees rotation. This figure is referenced by a number of authors as a result of the relevant magnetic anomalies influencing the compass readings.
(c) If a new frame, equal to the old map’s, is placed in various projection-systems in a way of keeping its left side parallel to the west coasts of the Iberian Peninsula, e.g. in a normal conic projection (Fig. 2) or in a normal cylindrical projection (Fig. 3), then the old map either should rotate a great deal in order to come into its regular position or the 36 degrees parallel takes certain shape, not relevant to its original image on the old map. For example, it is transformed into a line of strong curvature (Fig. 2) or into a straight line (Fig. 3).
Figure 2. Graphic
Figure 2. The normal conic projection (in red). The frame of the portolan-map (in black) is oriented with the left side parallel to the Atlantic Iberian coasts.
Figure 3. Graphic
Figure 3. The normal cylindrical projection (in red). The frame of the portolan-map (in black) is oriented with the left side parallel to the Atlantic Iberian coasts.
The above observations, coupled with certain hypotheses already stated in the relevant literature, concerning the presumable use by mapmakers of oblique cylindrical or conic projections (among other possible), lead to the conclusion of using in our optimal fitting tests a variety of oblique projections. The final adoption of a uniquely defined oblique conic projection is based on the ‘trial and error’ process, as described above.
The optimal fitting
Following the above reasoning, the test projection selected is an oblique conformal Lambert projection, which is reduced to an oblique cylindrical counterpart according to the list of parameters used to define the projection[3] (Fig. 4). The adopted test projection fits optimally the Mediterranean portolan-maps to their modern counterparts. This choice gave satisfactory results from the very first approximation of the fitting process, both in configuration and in numbers, since all portolan-maps are optimally fitted keeping unaltered their initial orientation.
Figure 4. Graphic
Figure 4. The projection parameters protocol.
Applying this model projection and the optimal fitting, the placement of the frame of the old map is as represented in Fig. 5 and the Sideri’s Europe and the Mediterranean as in Fig. 6. The comparison of Figs. 1, 5 and 6 confirms the proper choice of this projection, which satisfies, as well, the optimal fitting of Olliva’s (Fig. 7) and Vourdopoulos’ (Fig. 8) portolan maps using 25 control points. The same projection has also proved to satisfy the maps of the Aegean Sea by Vesconte (Fig. 9), Millo (Fig. 10) and Reis (Fig. 11) using 15 to 20 control points for the optimal fitting process.
The optimal fitting of all portolan maps to the adopted test projection is obviously of ‘global’ character. This means that the fitting concerns the overall configuration of the old maps and not the local parts of it. Locally, in some cases the fitting brings closer the old map to the model and in some others not. These cases are discussed in the next paragraph.
Figure 5. Graphic
Figure 5. Europe and the Mediterranean Sea are represented in the oblique conic projection (in red) as well as the frame of Sideri’s map (in black), after the fitting. The comparison with Fig. 1 confirms the proper choice of this projection.
Figure 6. Graphic
Figure 6. Sideri’s map associated to the oblique conic projection and the protocol in Fig. 4.
Figure 7. Graphic
Figure 7. Olliva's map associated to the oblique conic projection and the protocol in Fig. 4.
Figure 8. Graphic
Figure 8. Vourdopoulos’ map associated to the oblique conic projection and the protocol in Fig. 4.
Figure 9. Graphic
Figure 9. Vesconte’s map associated to the oblique conic projection and the protocol in Fig. 4.
Figure 10. Graphic
Figure 10. Millo’s map associated to the oblique conic projection and the protocol in Fig. 4.
Figure 11. Graphic
Figure 11. Reis’ map associated to the oblique conic projection and the protocol in Fig. 4.
Discussion on the results
Concerning the portolan maps of the Mediterranean, some areas result systematically less fitted than some others. North Adriatic and Northwest Aegean are not depicted with the same best accuracy compared to other areas, namely the Canaries, Majorca, Corsica and Sardinia, Sicily and the adjacent Italian coasts, the northern coasts of Africa and the islands of Crete, Chios, Kythera and Karpathos in the Aegean. The representation seems to be good, with respect to the projection frame, along the sea route from Gibraltar to Constantinople and to the East Mediterranean basin. The projective consistency of the fitting of the Aegean Vesconte’s map within Sideri’s map of the Mediterranean (Fig. 12) is impressive, in association to the adopted oblique conic projection.
In all tests carried out here, it is obvious that the oblique conic projection, as defined in the protocol of Fig. 4, satisfies the projective content of a variety of maps, both regional (Mediterranean) and local (Aegean) covering almost two centuries, from early 14th to early 17th. The ‘trial and error’ procedure followed, is actually an inverse process due to which, a suitable map projection is searched in order to fit optimally the geometric features of the portolan-maps. On a phenomenological basis, the projection associated to all maps tested here, seems to be ‘applicable’ to all tested portolan maps. In this context it is interesting to stress the coincidence of the results obtained for Millo’s map (Fig. 10) to those derived in another relevant study referred to the same map (Boutoura 2000: 84).
Figure 12. Graphic
Figure 12. The Sideri’s Mediterranean map and the Vesconte’s map of the Aegean map in a unique oblique conic projection scheme defined by the protocol in Fig. 4.
It is evident that this type of analysis does not solve the still open problem of the projective properties and origins of the portolan-maps. It contributes to give some new impulses and insights in this field of studies, showing the great potentiality of modern digital tools embedded in common processing environments as far as the computations and the visualisation are concerned. In this way the testing of a manifold of alternative hypotheses and theories assigned to the issue becomes an easy task to try.
References
Astengo, C. (2000). La cartografia nautica mediterranea dei secoli XVI e XVII. Genova: Erga.
Balletti, C. (2000). Metodi analitici e quantitative per lo studio del contenuto geometrico delle carte storiche. Tesi di dottorato di ricerca in scienze geodetiche e topografiche, XIII ciclo. Milano: Politecnico.
Balletti, C., C. Boutoura, C. (2001). Revisiting the projective properties of historic nautical maps of the Mediterranean and the Aegean. In Mapping the 21st century, Proceedings of the 20th International Cartographic Conference, vol. 1, Beijing: State Bureau of Surveying and Mapping, 296-302.
Baso, G., M. Scarso (2000). Spazi imaginari e ordine geografico: Il mare Egeo tra portolani, carte nautiche e isolari. In Livieratos. E. (ed.), Raggi di venti sul mare. Thessaloniki: National Centre for Maps and Cartographic Heritage, 53-63.
Biadene, S., C. Tonini (2000). Viaggio attraverso le pianure liquide: La collezione di portolani e carte nautiche del Museo Correr di Venezia. In Livieratos. E. (ed.), Raggi di venti sul mare. Thessaloniki: National Centre for Maps and Cartographic Heritage, 25-31.
Boutoura, C. (2000). Scoperta di un reticolo geografico in una carta nautica dell'Egeo del XVI secolo. In Livieratos. E. (ed.), Raggi di venti sul mare. Thessaloniki: National Centre for Maps and Cartographic Heritage, 78-88.
Boutoura, C., Livieratos, E. (2004). Fitting ottimali numerici delle rappresentazioni cartografiche storiche. Un'applicazione alle Isole Ionie. In Livieratos, E., E. Beriatos, C. Balletti, M. Scarso (eds.) L'Eptaneso nelle carte, da Tolomeo ai satelliti. Padova: Il Poligrafo, 181-190.
Campbell, T. (1987). Portolan charts from the late thirteen century to 1500. In Harley, J. B., D. Woodward, (eds.), History of Cartography, vol. 1. Chicago: Univ. Press, 371-463.
Fiorini, M. (1881). Le proiezioni delle carte geografiche. Bologna: Zanichelli.
Forstner, G., M. Oehrli (1998). Graphische Darstellungen der Untersuchungsergebnisse alter Karten und die Entwicklung der Verzerrungsgitter, Cartographica Helvetica 17, 35-43.
Guerra, F., C. Balletti, C. Monti, E. Livieratos, C. Boutoura (1999). Informatica e ‘infografica’ per lo studio della veduta prospettica di Venezia. In Romanelli, G., S. Biadene, C. Tonini (eds.), A volo d’uccello, Jacopo de’ Barbari e le rappresentazioni di citta` nell’Europa del Rinascimento. Venezia: Arsenale, 93-100.
Livieratos, E. (2004). On some cartographic representations of the insular components of the Ardia–Ionian Sea. In E. Beriatos, E. Livieratos (eds.) Adrionian Extrema-Proxima. From an ancient sea to a modern network. Thessaloniki: National Centre for Maps and Cartographic Heritage, 355-380.
Mollat du Jourdin, M., M. de La Ronciere (1984). Les portulans, Cartes marins du XIIIe au XVIIe siécle. Fribourg: Office du Livre.
Tobler, W. R. (1965). Medieval Distortions: The Projections of Ancient Maps. Annals of the Association of American Geographers 56 (2), 351-360.
* Professor of digital catrography, Aristotle University of Thessaloniki, Greece.
Email Chryssoula Boutoura
[1] Musei Civici Veneziani.
[2] Coincides with the famous diaphragma of Dichaearchus, c. 4th century B.C.
[3] Here, the Intergraph’s projection manager environment is used.
From:
http://www.maplibrary.gr/e_Perimetron/Vol_1_1/Boutoura/1_1_Boutoura.htm#_ftn1